In his first policy address to the Japanese parliament on October 26, 2020, Prime Minister Yoshihide Suga declared that Japan would aim to achieve carbon neutrality (hereinafter “CN”) by the year 2050. Over 120 countries around the world have pledged to achieve carbon neutrality by 2050. Each country will face a unique set of societal and geographical conditions in working toward achieving the goal; strategies must be tailored to these unique circumstances. We have analyzed the conditions facing Japan, its starting point, in terms of energy supply and demand through international comparison1.
Japan’s Starting Point toward Carbon Neutrality
An international comparison
2021.1.28
1. Japan has Highest Emissions Among Peers: Around 60% of emissions come from non-power sector
In the 2018 fiscal year, Japan saw energy-originated carbon-dioxide (CO2) emissions reach 1.07 billion tons–the highest among countries pledging carbon neutrality by 2050 (Figure 1). Of the 1.07 billion tons, the power sector accounted for 460 million tons in emissions, and non-power sectors accounted for 600 million tons, or about 60% of the total. Among the non-power sectors, emission levels formed a 3:2:1 ratio for industry, transport, and building-sector. Within the industry and transportation sectors, we focused on steelmaking and freight respectively as each comprise 40% of emissions for their relative sector; these are considered as among the most difficult to decarbonize. Amidst such levels, Japan has the task of achieving an emission total of zero by 2050.
Figure 1: Energy-Originated CO2 Emissions of Countries Pledging Carbon Neutrality by 2050 and Japan’s Emissions Situation (2018)
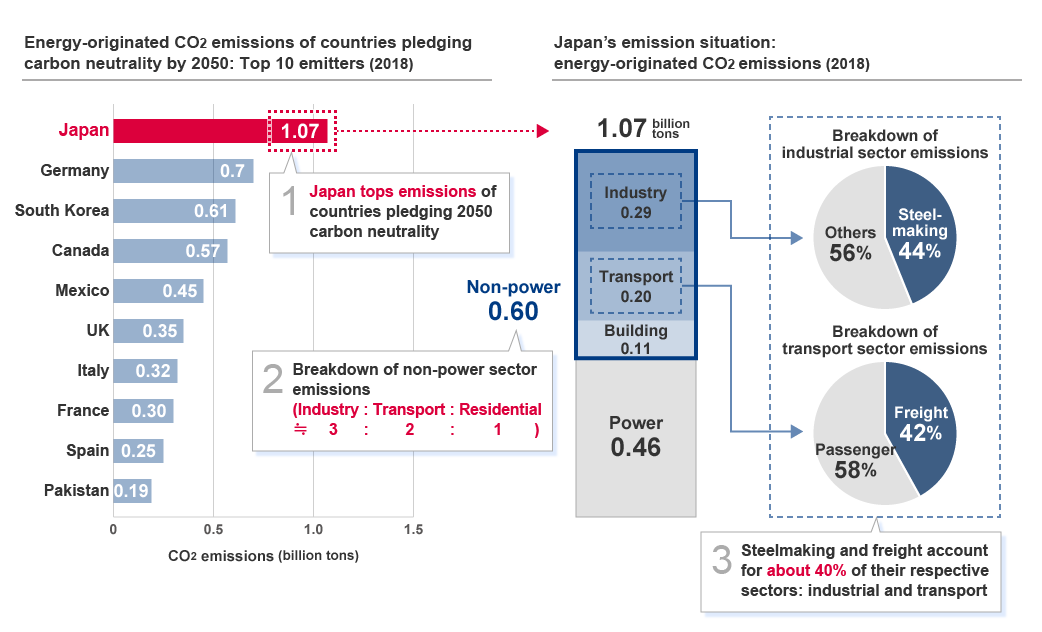
Source: Prepared by Mitsubishi Research Institute, Inc. based on IEA CO2 Emissions from Fuel Combustion Statistics2 and the Agency of Natural Resources and Energy comprehensive energy statistics of Japan
2. Japan Tops 2050 Carbon Neutral Pledge Countries in Total Power Production: Percentage of fossil-fuel power significantly high
Japan currently generates around 80% of its power from fossil fuels. Given the urgency of decarbonization, particularly in the power sector, Japan must reduce emissions from these sources if it is to fulfill its carbon neutrality pledge. For most countries pledging 2050 carbon neutrality fossil-fuel power plays a relatively small role in their power generation mix (Figure 2). The larger a country’s total power production, the more carbon-neutral sources are required to lower the percentage of fossil-fuel power. Moreover, countries without a pledge to carbon neutrality tend to be those with both a large total power production and a high percentage of fossil-fuel power.
Figure 2: Ratio of Fossil Fuel Power in Total Produced Power by Country (2018)3
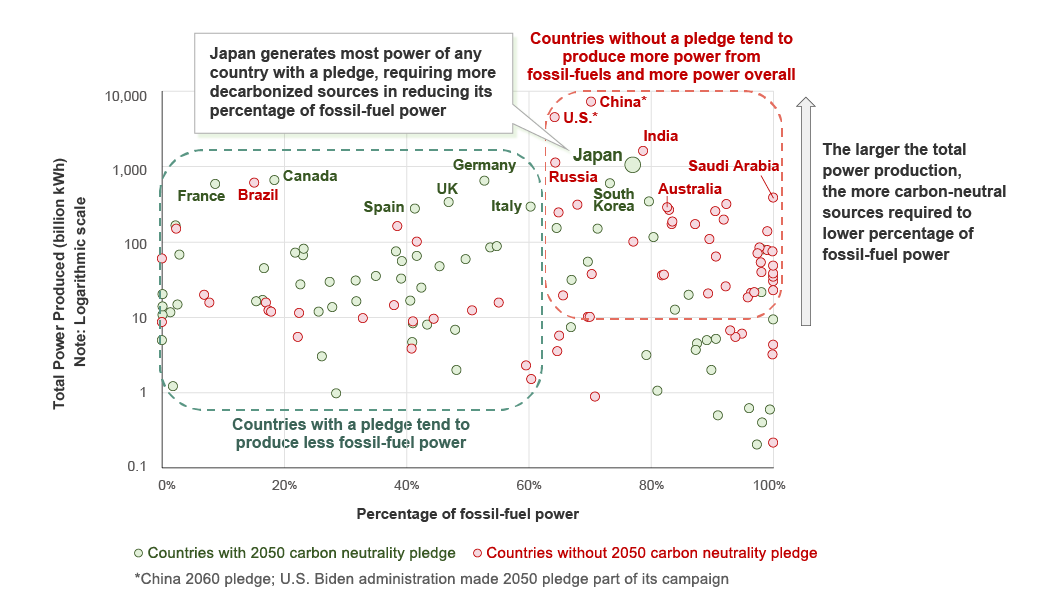
Source: Prepared by Mitsubishi Research Institute, Inc. based on IEA World Energy Statistics and Balances4
Japan generates the most electricity of any country that has pledged to carbon neutrality by 2050. As such, more so than other pledging countries, Japan will require both established technologies and emerging technologies that contribute to its decarbonization and thus reduce its percentage of fossil-fuel power.
Figure 3: Established Technologies and Emerging Technologies
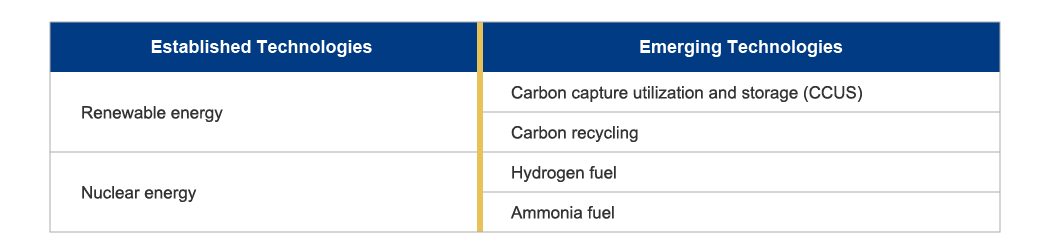
Source: Mitsubishi Research Institute, Inc.
3. Japan Has High Ratio of Industries Difficult to Decarbonize: Steelmaking and freight stand out
The industrial sector accounts for 34% of Japan's non-power energy consumption—the highest among the top-ten carbon emitting countries with a 2050 pledge (Figure 4). Japan is double that of the UK’s 16%, the lowest of the ten countries, illustrating how differences in industrial structures shape a country’s energy consumption.
Reducing emissions will be particularly challenging in certain industries within the industrial sector, specifically steelmaking and freight, the latter including road, air, and water. Hydrogen deployment will be essential in these fields. Japan's steelmaking industry also accounts for the largest share of energy consumption even when compared to the highest-emitting countries. Also, the freight industry's share of the transport sector is on par with that of the other highest-emitting countries. Here too, technical innovation centered on decarbonized fuels will be vital for reducing emissions in Japan's non-power sectors.
Reducing emissions will be particularly challenging in certain industries within the industrial sector, specifically steelmaking and freight, the latter including road, air, and water. Hydrogen deployment will be essential in these fields. Japan's steelmaking industry also accounts for the largest share of energy consumption even when compared to the highest-emitting countries. Also, the freight industry's share of the transport sector is on par with that of the other highest-emitting countries. Here too, technical innovation centered on decarbonized fuels will be vital for reducing emissions in Japan's non-power sectors.
Figure 4: Emissions of Non-Power Sectors among Highest-Emitting Countries Pledging 2050 Carbon Neutrality4
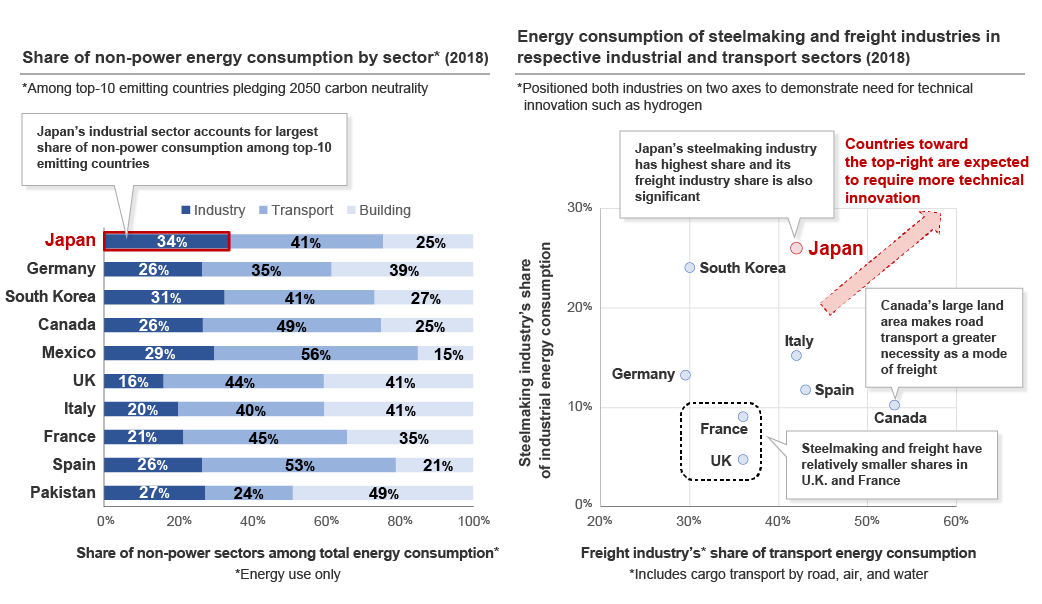
Source: Prepared by Mitsubishi Research Institute, Inc. based on IEA World Energy Statistics and Balances 5 and IEA Energy Efficiency Indicators Highlights 2020 edition 6
In order to achieve its carbon neutrality target, Japan must reduce emissions through utilizing existing decarbonization options and promoting new technical innovation in both power and non-power sectors. Accordingly, Japan may face a need for technological development that is more pressing than in other countries. Japan can position its pursuit for carbon neutrality, mutually beneficial for the economy and the environment, as its growth strategy moving forward.
1:The EU’s 2050 carbon neutrality pledge was made at the regional level. This analysis examines the issue on a country-by-country basis.
2:International Energy Agency (2021), "Detailed CO2 estimates", IEA CO2 Emissions from Fuel Combustion Statistics (database).
https://doi.org/10.1787/data-00429-en (accessed on 8 January 2021)
3:This analysis covers 144 countries for which IEA statistical data is obtainable.
4:The chart on the right (steelmaking and freight industries’ share of energy consumption in their respective industrial and transport sectors) includes only OECD member countries due to the limitations of IEA statistical data.
5:International Energy Agency (2021), "Extended world energy balances", IEA World Energy Statistics and Balances (database).
https://doi.org/10.1787/data-00513-en (accessed on 8 January 2021)
6:International Energy Agency (2020), “IEA Energy Efficiency Indicators Highlights 2020 edition” IEA Publications.